
Business
Stellantis Reports 7% Growth in Q3 2023 Net Revenues, Driven by Continued Strength in Shipments Year-Over-Year
Published
3 years agoon
In an industry still affected by unprecedented disruptions and transformations, Stellantis and its dealer network in Europe have strengthened their partnership to improve customer experience and streamline the overall customer journey
AMSTERDAM, Netherlands, November 1, 2023/APO Group/ —
Net revenues of €45.1 billion, up 7% compared to Q3 2022, mainly reflecting improved volume and consistent pricing, partially offset by foreign exchange impacts; Consolidated shipments(1) of 1,427 thousand units, up 11% versus Q3 2022, with Enlarged Europe, Middle East & Africa, North America and South America reporting year-over-year improvements; Total new vehicle inventory of 1,387 thousand units at September 30, 2023. Company inventory of 388 thousand units, up 158 thousand units from December 31, 2022 reflecting a return to more normal levels after a multi-year period of materially-constrained supplies; Tentative agreement reached with both UAW and Unifor. Work stoppages negatively impacted Net revenues by approximately €3 billion, compared to planned production, through October; Global BEV sales up 37% versus Q3 2022 mainly driven by the Jeep® Avenger and growing commercial BEV vehicles sales led by the Citroën ë-Berlingo; The Company repurchased €0.5 billion in shares during Q3 2023. During the nine months ended September 30, 2023, €1.2 billion in shares were repurchased. The Company expects to complete the announced €1.5 billion 2023 Share Buyback Program during Q4 2023. “In the first half of this year, Stellantis (www.Stellantis.com) emerged as the industry leader for AOI, AOI margin, and Industrial Free Cash Flows among its comparable peers. Today, we are focused on maintaining our momentum by delivering industry-leading profitability and cash flows, addressing critical near-term industry challenges, and continuing our electrification and technology transformation. This growth is propelling the execution of our Dare Forward 2030 strategy”: Natalie Knight, CFO.
Stellantis N.V. continued to build momentum in Q3 2023, delivering a 7% year-over-year increase of Net revenues driven by continued strength in shipments. The Company’s “Third Engine”(5) achieved 25% revenue growth year-over-year. Global BEV sales were up 37% versus third quarter 2022, led by the following vehicles: Jeep® Avenger, Citroën Ami, Peugeot E-208, Fiat New 500e, and Citroën ë-Berlingo. Key activities executed to achieve the Dare Forward 2030 strategic plan include:
Care: In an industry still affected by unprecedented disruptions and transformations, Stellantis and its dealer network in Europe have strengthened their partnership to improve customer experience and streamline the overall customer journey. With the signing of over 8,000 sales and 25,000 aftersales contracts across 10 strategic European countries, it is clear that Stellantis and its business partners share the same goals when it comes to simplification, multi-brand approach, customer centricity, and quality assurance. Austria, Belgium, Luxembourg, and Netherlands have already adopted the new contracts, with the rest of Europe to begin adopting the new model starting in 2024.
Tech: Peugeot revealed the first application of STLA Medium – the first of Stellantis’ four global BEV-by-design platforms – with the new E-3008, offering a best-in-class range of up to 700 km, charging time, performance, efficiency, and driving pleasure. Fiat returned to the B-segment, leading the way for sustainable urban mobility, with the new 600e, which boasts state-of-the-art safety features and an electric range of more than 400km (WLTP(6) combined cycle) and more than 600 km (WLTP(6) urban cycle) in the city. Fiat also unveiled the new Topolino micro-mobility offer with a 75km range and a safe top speed of 45 km/h. The Company also announced the start of all-electric van production at Ellesmere Port – the UK’s first EV-only volume manufacturing plant – and the first Stellantis plant globally dedicated to electric vehicles.
Coming to the market soon is the all-electric Citroën ë-C3. The first affordable European electric car, the ë-C3 delivers best-in-class comfort, and easy electric life thanks to a 44kWh battery pack providing up to 320km (199 miles) WLTP(6) driving range, at fair and net prices in many European markets, starting at €23,300.
Stellantis celebrated the opening of its state-of-the-art Battery Technology Center at the Mirafiori complex in Turin, Italy. The center enhances the Company’s capabilities to design, develop and test battery packs, modules, high-voltage cells, and software to power upcoming Stellantis brand vehicles.
The Company continued to strengthen its global electrification ecosystem and support its carbon neutrality ambitions: (i) concluding testing with Aramco on the compatibility of 24 engine families to use advanced drop-in eFuels, which will lower CO2 emissions of a potential 28 million Stellantis vehicles currently on the road; (ii) unveiling with Saft the Intelligent Battery Integrated System, which the project team intends to make commercially available on Stellantis vehicles before the end of this decade; (iii) announcing plans for a sixth gigafactory globally to support its bold electrification plan of securing approximately 400 GWh of battery capacity; it will be the second facility to be built in the U.S. with Samsung SDI; (iv) investing in Controlled Thermal Resources Holdings Inc.’s Hell’s Kitchen project to produce up to 300,000 metric tons of lithium carbonate equivalent each year; and (v) completing its 33.3% purchase of Symbio, a leader in zero-emission hydrogen mobility to help secure Stellantis’ leadership position in hydrogen-powered vehicles.
Value: To accelerate the transition to electric vehicles in North America, Stellantis and six major global automakers will create an unprecedented charging network installing at least 30,000 high-powered charge points.
Stellantis is also implementing a multifaceted strategy designed to manage and secure the long-term supply of vital microchips, delivering the objectives laid out in Dare Forward 2030. Stellantis’ strategy combines agreements with chip makers for critical semiconductors, purchase of mission-critical parts, and full visibility of future chip needs.
The Company repurchased €0.5 billion in shares during Q3 2023. During the nine months ended September 30, 2023, €1.2 billion in shares were repurchased. The Company expects to complete the announced €1.5 billion 2023 Share Buyback Program during Q4 2023.
In October 2023, the Company announced its plans to acquire approximately 20% of Leapmotor for approximately €1.5 billion and to form Leapmotor International, a 51/49 Stellantis-led joint venture with exclusive rights for the export and sale, as well as manufacturing, of Leapmotor products outside Greater China.
In October 2023, the Company introduced Pro One as the enhanced strategic offensive of its commercial vehicles business to achieve global leadership, encompassing the professional offerings of six iconic brands of Stellantis – Citroën, FIAT Professional, Opel, Peugeot, Ram and Vauxhall, and to support achievement of the Dare Forward 2030 strategic plan targets.
On October 31, 2023 at 2:00 p.m. CET / 9:00 a.m. EDT, a live audio webcast and conference call will be held to present Stellantis’ Third Quarter 2023 Shipments and Revenues. The audio webcast and recorded replay will be accessible under the Investors section of the Stellantis corporate website at www.Stellantis.com. The presentation material is expected to be posted under the Investors section of the Stellantis corporate website at approximately 8:00 a.m. CET / 3:00 a.m. EDT on October 31, 2023.
Upcoming events:
- Full Year 2023 Results – February 15, 2024
- Investor Day 2024, Auburn Hills, Michigan, USA – June 13, 2024
| Q3 2023 | Q3 2022 | Change | FY 2023 GUIDANCE – CONFIRMEDAdjusted Operating Income Margin(2) Double-DigitIndustrial Free Cash Flows(3) Positive€1.5 billion Share Buyback Program On-Track2023 INDUSTRY OUTLOOK(4)*North America +8% (from 5%)Enlarged Europe +10% (from 7%)Middle East & Africa +10% (from 7%)South America Stable (from 3%)India & Asia Pacific +5% (unchanged)China +2% (unchanged)*2023 Industry Outlook changed for NA, EE, MEA and SA compared to outlook provided on Jul 26 ’23 | ||||||
| Combined shipments (000 units) | 1,478 | 1,334 | +11% | ||||||
| Consolidated shipments (000 units) | 1,427 | 1,281 | +11% | ||||||
| Net revenues (€ billion) | 45.1 | 42.1 | +7% | ||||||
| YTD 2023 | YTD 2022 | Change | |||||||
| Combined shipments (000 units) | 4,805 | 4,367 | +10% | ||||||
| Consolidated shipments (000 units) | 4,629 | 4,215 | +10% | ||||||
| Net revenues (€ billion) | 143.5 | 130.1 | +10% | ||||||
____________________________________________________________________________________________________________________________________
All reported data is unaudited. Reference should be made to the section “Safe Harbor Statement” included elsewhere within this document.
Segment Performance
| NORTH AMERICA | ||||||||||||
| Q3 2023 | Q3 2022 | Change | Shipments up 7%, led by Chrysler (in particular Pacifica PHEV) which more than doubled y-o-y; Dodge and Ram also improved; Jeep shipments down due to the discontinued current generation Cherokee and scheduled downtime of the Compass, partially offset by Grand Cherokee which nearly doubledNet revenues up 2%, primarily due to higher volumes, positive net pricing and positive mix, mostly offset by unfavorable FX translation effects | YTD 2023 | YTD 2022 | |||||||
| Shipments (000s) | 470 | 441 | +29 | 1,493 | 1,400 | |||||||
| Net revenues (€ million) | 21,523 | 21,071 | +452 | 67,439 | 63,514 | |||||||
| ENLARGED EUROPE | ||||||||||||
| Q3 2023 | Q3 2022 | Change | Shipments up 11%, driven by increased shipments of Opel/Vauxhall (in particular Astra), Fiat Professional (led by Ducato) and Peugeot (led by 208), as well as increased demand for BEVs, led by Jeep AvengerNet revenues up 5%, mainly due to increased volumes and stable net pricing | YTD 2023 | YTD 2022 | |||||||
| Shipments (000s) | 599 | 538 | +61 | 2,077 | 1,900 | |||||||
| Net revenues (€ million) | 14,124 | 13,486 | +638 | 48,985 | 44,805 | |||||||
| MIDDLE EAST & AFRICA | ||||||||||||
| Q3 2023 | Q3 2022 | Change | Consolidated shipments up 102%, led by robust growth in Fiat shipments; Opel, Peugeot and Citroën models also grew significantly, partially offset by a decrease in Jeep brand shipmentsNet revenues up 128%, primarily due to increased volumes and positive net pricing, partially offset by negative FX translation effects, mainly from Turkish lira | YTD 2023 | YTD 2022 | |||||||
| Combined shipments (000s)(1) | 139 | 87 | +52 | 440 | 286 | |||||||
| Consolidated shipments (000s)(1) | 105 | 52 | +53 | 313 | 190 | |||||||
| Net revenues (€ million) | 3,021 | 1,324 | +1,697 | 7,719 | 4,363 | |||||||
| SOUTH AMERICA | ||||||||||||
| Q3 2023 | Q3 2022 | Change | Shipments up 7%, due to higher Fiat volumes (led by Fastback), Fiat Professional, Peugeot and Ram shipmentsNet revenues up 8%, mainly due to increased volumes and favorable net pricing, partially offset by negative FX translation effects, mostly Argentinian peso | YTD 2023 | YTD 2022 | |||||||
| Shipments (000s) | 227 | 213 | +14 | 647 | 616 | |||||||
| Net revenues (€ million) | 4,285 | 3,965 | +320 | 11,848 | 11,198 | |||||||
| CHINA AND INDIA & ASIA PACIFIC | ||||||||||||
| Q3 2023 | Q3 2022 | Change | Consolidated shipments down 33%, due to decreased shipments of Jeep and Peugeot; mitigated by increased Alfa Romeo (due to all-new Tonale)Net revenues down 38%, mainly due to decreased volumes and negative FX translation effects | YTD 2023 | YTD 2022 | |||||||
| Combined shipments (000s)(1) | 37 | 48 | (11) | 127 | 148 | |||||||
| Consolidated shipments (000s)(1) | 20 | 30 | (10) | 78 | 92 | |||||||
| Net revenues (€ million) | 705 | 1,138 | (433) | 2,691 | 3,290 | |||||||
| MASERATI | ||||||||||||
| Q3 2023 | Q3 2022 | Change | Shipments down 20%, due to lower volumes in China; Levante and Ghibli shipments down, partially offset by higher Grecale volumesNet revenues down 21%, primarily due to decreased volumes and unfavorable FX translation effects | YTD 2023 | YTD 2022 | |||||||
| Shipments (000s) | 5.3 | 6.6 | (1.3) | 20.6 | 16.8 | |||||||
| Net revenues (€ million) | 496 | 630 | (134) | 1,805 | 1,571 | |||||||
Reconciliations
Net revenues from external customers to Net revenues
| Q3 2023 | (€ million) | NORTH AMERICA | ENLARGED EUROPE | MIDDLE EAST & AFRICA | SOUTH AMERICA | CHINA AND INDIA & ASIA PACIFIC | MASERATI | OTHER(*) | STELLANTIS | ||||||||
| Net revenues from external customers | 21,522 | 14,077 | 3,022 | 4,320 | 705 | 495 | 995 | 45,136 | |||||||||
| Net revenues from transactions with other segments | 1 | 47 | (1) | (35) | — | 1 | (13) | — | |||||||||
| Net revenues | 21,523 | 14,124 | 3,021 | 4,285 | 705 | 496 | 982 | 45,136 | |||||||||
___________________________________________________________________________________________________________________
(*) Other activities, unallocated items and eliminations
| Q3 2022 | (€ million) | NORTH AMERICA | ENLARGED EUROPE | MIDDLE EAST & AFRICA | SOUTH AMERICA | CHINA AND INDIA & ASIA PACIFIC | MASERATI | OTHER(*) | STELLANTIS | ||||||||
| Net revenues from external customers | 21,070 | 13,467 | 1,324 | 3,978 | 1,136 | 631 | 495 | 42,101 | |||||||||
| Net revenues from transactions with other segments | 1 | 19 | — | (13) | 2 | (1) | (8) | — | |||||||||
| Net revenues | 21,071 | 13,486 | 1,324 | 3,965 | 1,138 | 630 | 487 | 42,101 | |||||||||
___________________________________________________________________________________________________________________
(*) Other activities, unallocated items and eliminations
| YTD 2023 | (€ million) | NORTH AMERICA | ENLARGED EUROPE | MIDDLE EAST & AFRICA | SOUTH AMERICA | CHINA AND INDIA & ASIA PACIFIC | MASERATI | OTHER(*) | STELLANTIS | ||||||||
| Net revenues from external customers | 67,438 | 48,888 | 7,720 | 11,929 | 2,690 | 1,805 | 3,034 | 143,504 | |||||||||
| Net revenues from transactions with other segments | 1 | 97 | (1) | (81) | 1 | — | (17) | — | |||||||||
| Net revenues | 67,439 | 48,985 | 7,719 | 11,848 | 2,691 | 1,805 | 3,017 | 143,504 | |||||||||
___________________________________________________________________________________________________________________
(*) Other activities, unallocated items and eliminations
| YTD 2022 | (€ million) | NORTH AMERICA | ENLARGED EUROPE | MIDDLE EAST & AFRICA | SOUTH AMERICA | CHINA AND INDIA & ASIA PACIFIC | MASERATI | OTHER(*) | STELLANTIS | ||||||||
| Net revenues from external customers | 63,512 | 44,742 | 4,363 | 11,211 | 3,286 | 1,574 | 1,412 | 130,100 | |||||||||
| Net revenues from transactions with other segments | 2 | 63 | — | (13) | 4 | (3) | (53) | — | |||||||||
| Net revenues | 63,514 | 44,805 | 4,363 | 11,198 | 3,290 | 1,571 | 1,359 | 130,100 | |||||||||
______________________________________________________________________________________
(*) Other activities, unallocated items and eliminations
Rankings, market share and other industry information are derived from third-party industry sources (e.g. Agence Nationale des Titres Sécurisés (ANTS), Associação Nacional dos Fabricantes de Veículos Automotores (ANFAVEA), Ministry of Infrastructure and Sustainable Mobility (MIMS), Ward’s Automotive) and internal information unless otherwise stated.
For purposes of this document, and unless otherwise stated industry and market share information are for passenger cars (PC) plus light commercial vehicles (LCV), except as noted below:
- Middle East & Africa exclude Iran, Sudan and Syria;
- South America excludes Cuba;
- India & Asia Pacific reflects aggregate for major markets where Stellantis competes (Japan (PC), India (PC), South Korea (PC + Pickups), Australia, New Zealand and South East Asia);
- China represents PC only; and
- Maserati reflects aggregate for 17 major markets where Maserati competes and is derived from S&P Global data, Maserati competitive segment and internal information.
Prior period figures have been updated to reflect current information provided by third-party industry sources.
Commercial Vehicles include vans, light and heavy-duty trucks and passenger vehicles registered or converted for commercial use.
EU30 = EU 27 (excluding Malta), Iceland, Norway, Switzerland and UK.
Low emission vehicles (LEV) = battery electric (BEV), plug-in hybrid (PHEV) and fuel cell electric (FCEV) vehicles.
All Stellantis reported BEV and LEV sales include Citroën Ami and Opel Rocks-e; in countries where these vehicles are classified as quadricycles, they are excluded from Stellantis reported combined sales, industry sales and market share figures.
Safe Harbor Statement
This document, in particular references to “FY 2023 Guidance”, contains forward looking statements. In particular, statements regarding future financial performance and the Company’s expectations as to the achievement of certain targeted metrics, including revenues, industrial free cash flows, vehicle shipments, capital investments, research and development costs and other expenses at any future date or for any future period are forward-looking statements. These statements may include terms such as “may”, “will”, “expect”, “could”, “should”, “intend”, “estimate”, “anticipate”, “believe”, “remain”, “on track”, “design”, “target”, “objective”, “goal”, “forecast”, “projection”, “outlook”, “prospects”, “plan”, or similar terms. Forward-looking statements are not guarantees of future performance. Rather, they are based on the Company’s current state of knowledge, future expectations and projections about future events and are by their nature, subject to inherent risks and uncertainties. They relate to events and depend on circumstances that may or may not occur or exist in the future and, as such, undue reliance should not be placed on them.
Actual results may differ materially from those expressed in forward-looking statements as a result of a variety of factors, including: the Company’s ability to launch new products successfully and to maintain vehicle shipment volumes; changes in the global financial markets, general economic environment and changes in demand for automotive products, which is subject to cyclicality; the Company’s ability to realize the anticipated benefits of the merger; the Company’s ability to offer innovative, attractive products and to develop, manufacture and sell vehicles with advanced features including enhanced electrification, connectivity and autonomous-driving characteristics; the continued impact of unfilled semiconductor orders; the Company’s ability to successfully manage the industry-wide transition from internal combustion engines to full electrification; the Company’s ability to produce or procure electric batteries with competitive performance, cost and at required volumes; a significant malfunction, disruption or security breach compromising information technology systems or the electronic control systems contained in the Company’s vehicles; exchange rate fluctuations, interest rate changes, credit risk and other market risks; increases in costs, disruptions of supply or shortages of raw materials, parts, components and systems used in the Company’s vehicles; changes in local economic and political conditions; changes in trade policy, the imposition of global and regional tariffs or tariffs targeted to the automotive industry, the enactment of tax reforms or other changes in tax laws and regulations; the level of government economic incentives available to support the adoption of battery electric vehicles; various types of claims, lawsuits, governmental investigations and other contingencies, including product liability and warranty claims and environmental claims, investigations and lawsuits; material operating expenditures in relation to compliance with environmental, health and safety regulations; the level of competition in the automotive industry, which may increase due to consolidation and new entrants; the Company’s ability to attract and retain experienced management and employees; exposure to shortfalls in the funding of the Company’s defined benefit pension plans; the Company’s ability to provide or arrange for access to adequate financing for dealers and retail customers and associated risks related to the establishment and operations of financial services companies; the Company’s ability to access funding to execute its business plan; the Company’s ability to realize anticipated benefits from joint venture arrangements; disruptions arising from political, social and economic instability; risks associated with the Company’s relationships with employees, dealers and suppliers; the Company’s ability to maintain effective internal controls over financial reporting; developments in labor and industrial relations and developments in applicable labor laws; earthquakes or other disasters; and other risks and uncertainties.
Any forward-looking statements contained in this document speak only as of the date of this document and the Company disclaims any obligation to update or revise publicly forward-looking statements. Further information concerning the Company and its businesses, including factors that could materially affect the Company’s financial results, is included in the Company’s reports and filings with the U.S. Securities and Exchange Commission and AFM.
_________________________________________
Notes:
(1) Combined shipments include shipments by Company’s consolidated subsidiaries and unconsolidated joint ventures, whereas Consolidated shipments only include shipments by Company’s consolidated subsidiaries. Figures by segments may not add up due to rounding.
(2) Adjusted operating income/(loss) excludes from Net profit/(loss) adjustments comprising restructuring, impairments, asset write-offs, disposals of investments and unusual operating income/(expense) that are considered rare or discrete events and are infrequent in nature, as inclusion of such items is not considered to be indicative of the Company’s ongoing operating performance, and also excludes Net financial expenses/(income) and Tax expense/(benefit). Effective from January 1, 2023, our Adjusted operating income/(loss) includes Share of the profit/(loss) of equity method investees. The comparatives for the respective periods for 2022 have been adjusted accordingly.
This change was implemented as management believes these results are becoming increasingly relevant due to the number of partnerships Stellantis has recently engaged in, and will continue to engage in in the future, around electrification and other areas critical to the future of mobility.
Unusual operating income/(expense) are impacts from strategic decisions, as well as events considered rare or discrete and infrequent in nature, as inclusion of such items is not considered to be indicative of the Company’s ongoing operating performance. Unusual operating income/(expense) includes, but may not be limited to: impacts from strategic decisions to rationalize Stellantis’ core operations; facility-related costs stemming from Stellantis’ plans to match production capacity and cost structure to market demand, and convergence and integration costs directly related to significant acquisitions or mergers.
(3) Industrial free cash flows is calculated as Cash flows from operating activities less: cash flows from operating activities from discontinued operations; cash flows from operating activities related to financial services, net of eliminations; investments in property, plant and equipment and intangible assets for industrial activities; contributions of equity to joint ventures and minor acquisitions of consolidated subsidiaries and equity method and other investments; and adjusted for: net intercompany payments between continuing operations and discontinued operations; proceeds from disposal of assets and contributions to defined benefit pension plans, net of tax. The timing of Industrial free cash flows may be affected by the timing of monetization of receivables, factoring and the payment of accounts payables, as well as changes in other components of working capital, which can vary from period to period due to, among other things, cash management initiatives and other factors, some of which may be outside of the Company’s control.
(4) Source: IHS Global Insight, Wards, China Passenger Car Association and Company estimates
(5) Refers to the aggregation of the South America, Middle East & Africa and China and India & Asia Pacific segments for presentation purposes only
(6) Worldwide Harmonized Light Vehicles Test Cycle
Distributed by APO Group on behalf of Stellantis.
You may like
-


$2.1 Billion and Counting: African Real Estate Is Executing
-


ST Telemedia Global Data Centres Delivers on Responsible Scaling, Surpassing 2028 Carbon Intensity Target Three Years Early with Renewables at 83.2%
-


London Showcase to Bring Venezuela’s Energy Opportunities to Global Investors Ahead of 2026 Summit
-


October 2-4, 2026, Announced as New Date for the Inaugural Alamein Africa Forum
-


The Learning Engine: How Rolls-Royce Turns Every Flight into Better Engineering (By Omar Ali Adib)
-


New forum links capital with pioneering market reforms in Zim
Business
$2.1 Billion and Counting: African Real Estate Is Executing
Published
6 hours agoon
July 21, 2026
Ahead of the 17th Africa Property Investment (API) Summit in Cape Town, investment pipelines are converting into a record number of transactions as the continent’s real estate and hospitality sectors move from potential into real momentum
Download Document: https://apo-opa.co/3TraTiH
The 28 transactions (across nine countries and eight asset classes) were closed by API Summit stakeholders from across the institutional property ecosystem – spanning listed capital markets, commercial, residential, hospitality, logistics and alternatives.
The full African Deals Index report – compiled in collaboration with Broll, the data and insights partner for API Summit 2026 – will be unveiled on the opening day of the event, taking place at the Cape Town International Convention Centre on 17 and 18 September.
Talk turning to investment action
The deal-making activity is a signal of the much-spoken-about potential for Africa converting into tangible action, driven by enhanced investor confidence.
“This isn’t a forecast – it’s a balance sheet. $2.1 billion in completed transactions tells you African real estate has moved past the conversation about potential and into the discipline of execution,” said Malcolm Horne, Group CEO of Broll Property Group.
Horne highlighted several key shifts reflected in the data.
“What’s notable is where the conviction is coming from: domestic pension capital acting as a structuring investor, not a passive landlord, and green-linked financing becoming a board-level decision, not a marketing line. At Broll, we see this in our own data every day – across the assets we manage, the cost of capital is increasingly tied to the quality of the asset, not just its location.
“That’s the market maturing in real time, and it’s exactly the momentum my team and I are looking forward to presenting and unpacking at API this year.”
The 17th Annual API Summit takes place under the theme Bold Capital. Real Momentum. and is expected to attract over 600 delegates from more than 30 countries.
Niyi Adeyele, Head of Real Estate Finance, Africa Regions at Standard Bank Group, commented on the evolution of real estate sector funding across Africa.
“It remains interesting to track the resilience and the evolution of activities in the sector, from growing capital market activities, to the rapidly increasing participation of domestic capital sources within the African continent from domestic focused institutional capital sources such as pension funds and family offices to pan-African investor platforms that tend to operate across multiple countries.”
He said that accordingly, sectoral activity levels remain positive, with the “growing pace of green field projects in key markets” providing “early indications of a new growth cycle for the sector”.
Investors now have listed, liquid exposure to African real estate, and issuers have a repeatable route to permanent capital
Major moves from domestic capital and DFIs
Domestic pension capital has moved decisively beyond its traditional role as a passive landlord, emerging as an active, structuring investor in African real estate – a shift that will be central to discussions at the summit.
The charge was led by South Africa’s Government Employees Pension Fund (through the Public Investment Corporation and retail property powerhouse Pareto), which concluded commercial, residential and industrial transactions valued at over $343.5 million since the start of 2025.
“Through the Standard Bank Group’s franchise operations across multiple countries, there are observed increase deployment of institutional capital to across key markets driving increased primary and secondary market activities,” said Adeyele, pointing to examples such as Grene Capital’s raising of $100 million from Nigerian pension for property investments in Nigeria and beyond.
Sustainability-linked deal leads the way
Sustainability remains a critical factor in real estate financing considerations – evidenced by the largest transaction completed over the past 18 months.
Standard Bank and its African Regions brand Stanbic (along with Rand Merchant Bank) acted as co-lender on a $300 million green financing facility to facilitate Lango’s bid to become Africa’s first Green Pure Play real estate company, with 90% of its portfolio certified according to international standards.
Amongst several other milestones, the Africa Logistics Property (ALP) Industrial REIT listing on the Nairobi Stock Exchange in March 2026 was notable as East Africa’s first listing featuring entirely IFC EDGE-certified green buildings.
Listed capital makes major moves
REIT capital markets were the second largest asset class by value across the period, accounting for $568.5 million of activity, with the action extending well beyond South Africa’s established counters.
East Africa welcomed ALP’s Industrial REIT (marking the region’s first industrial and first USD-denominated security); Centum’s TRIFIC Dollar I-REIT (the first green, income-distributing USD-denominated) and Acorn Holdings’ build-to-rent D-REIT.
On Zimbabwe’s Victoria Falls Stock Exchange, the Pfuma Fund REIT and Eagle REIT both listed, deepening a hard-currency capital market that scarcely existed five years ago.
“Seeing multiple REITs listing on exchanges in one cycle tells you the asset class has crossed from novelty to norm. Investors now have listed, liquid exposure to African real estate, and issuers have a repeatable route to permanent capital,” said Raghav Gandhi, CEO of ALP.
API Summit 2026 – ushering in the next wave of deals
The unprecedented commitment of capital into Africa’s real estate sector takes centre stage when the 17th Annual API Summit convenes. Welcoming the investors, developers, financiers and policymakers behind the continent’s most prominent deals, this year’s event features a new Multifamily Forum alongside the popular Hospitality and Proptech Forums; an impactful main plenary, workshops, deals and meetings rooms and investment showcases, and the 10th edition of the prestigious API Awards.
For more information and to register, visit www.APISummit.co.za
Distributed by APO Group on behalf of API Events.
Business
ST Telemedia Global Data Centres Delivers on Responsible Scaling, Surpassing 2028 Carbon Intensity Target Three Years Early with Renewables at 83.2%
Published
11 hours agoon
July 21, 2026
SINGAPORE – Media OutReach Newswire – 21 July 2026 – ST Telemedia Global Data Centres (STT GDC) today published its 2025 Environmental, Social and Governance (ESG) Report, setting out how the Singapore-headquartered global data centre provider is meeting accelerating demand, including from AI-driven workloads, through infrastructure that is more resilient, efficient and sustainable by design. The report highlights 83.2% renewable energy usage, a 70.5% reduction in carbon intensity from its 2021 baseline, 41.2% improvement in water usage effectiveness (WUE) from the 2020 baseline, and continued progress in embedding ESG considerations into how STT GDC designs, builds, finances and operates its data centres at scale.
The report positions responsible growth as a core business discipline for STT GDC, linking sustainability performance to long-term asset resilience, customer trust and operational excellence. Across its global platform, STT GDC is integrating ESG considerations into capital allocation, site selection, design, operations, risk management and workforce development to support reliable digital infrastructure at scale.
Bruno Lopez, President and Group Chief Executive Officer, ST Telemedia Global Data Centres, says, “The next phase of digital growth will be defined by how the industry resolves the tension between rising demand — particularly from AI — and the finite nature of energy, water and land. Responsible scaling is therefore not a sustainability commitment alone; it is a commercial and operational imperative that shapes where we build, how we design, and how we run our data centre platform. Our 2025 progress reflects disciplined execution of a strategy we have been advancing for years, delivering meaningful improvements in energy efficiency, emissions and resource management across our global platform. As we scale further, we will continue to advance with the same discipline — in the infrastructure we build, the governance that underpins it, and the positive impact we create for the communities and ecosystems we are part of.”
Scaling efficient, lower-carbon infrastructure
STT GDC continued to advance its decarbonisation strategy in 2025, delivering measurable reductions in emissions and improvements in resource efficiency while scaling its global data centre platform to meet rising digital demand. The Group’s approach focuses on embedding sustainability into the design and operation of its infrastructure, enabling long-term performance while managing growing energy and resource requirements. Key environmental achievements include:
Furthered renewable energy adoption, with 83.2% of electricity consumption sourced from renewables, supporting STT GDC’s transition towards carbon-neutral operations by 2030.
Reduced carbon intensity by 70.5% from the 2021 baseline, surpassing STT GDC’s 2028 target three years ahead of schedule, alongside a 15.2% year-on-year reduction in absolute Scope 1 and 2 emissions
Improved energy efficiency across operations, achieving an average Power Usage Effectiveness (PUE) of 1.44, a 13.0% improvement from the 2020 baseline, reflecting continued optimisation of data centre design and operations.
Enhanced water stewardship, with Water Usage Effectiveness (WUE) improving by 41.2% from the 2020 baseline, supported by a balanced approach to managing energy and water use in cooling systems.
Continued progress in sustainable infrastructure, with 48% of its data centres achieving green building certification, reflecting the integration of sustainability considerations across the lifecycle of its facilities.
Building a safe and future-ready workforce
As STT GDC continues to scale its global data centre platform, investing in people, safety and workforce capabilities remains central to delivering reliable and sustainable operations. In 2025, the Group maintained a strong focus on safeguarding its workforce, strengthening organisational capability and supporting the development of future-ready talent to meet the growing demands of the digital economy. Key social achievements include:
Maintained strong safety performance, with zero work-related fatalities and a Total Recordable Incident Rate (TRIR) of 0.1 across more than 41 million hours worked, reflecting robust health and safety management across construction and operations.
Strengthened workforce capability, with an average of 18 training hours per employee, supporting the development of technical, operational and leadership skills across the organisation.
Advanced diversity and inclusion, with 21.7% women representation across the Group, reinforcing ongoing efforts to build a more inclusive and balanced workforce.
Expanded talent development initiatives, including the DC Power Up programme and partnerships with 10 Institutes of Higher Learning across our markets, helping to build a pipeline of industry-ready talent for the growing digital infrastructure sector.
Deepened community and workforce engagement, through skills development programmes and industry-academic partnerships that support long-term talent development and contribute to local economic growth.
Strengthening Governance and Resilience at Scale
Strong governance, disciplined risk management and robust operational controls underpin STT GDC’s ability to scale responsibly in an increasingly complex digital environment. In 2025, the Group continued to strengthen its enterprise-wide approach to governance, embedding ESG considerations into decision-making, risk management and day-to-day operations to support long-term resilience and performance. Key achievements include:
Strengthened governance and ethical business practices, with 100% of employees completing anti-corruption training, reinforcing STT GDC’s commitment to integrity and accountability across its global operations.
Enhanced enterprise-wide risk management, incorporating climate, cybersecurity and operational risks into planning and decision-making, ensuring infrastructure resilience as the Group scales.
Advanced cybersecurity and operational resilience, including strengthened governance, technical controls and preparedness through initiatives such as executive-level cyber exercises and risk assessments across key facilities.
Improved supply chain governance, embedding ESG criteria into procurement processes and reinforcing responsible sourcing practices across its global vendor network.
Strengthened organisational alignment and execution, through the inaugural Group ESG Summit, supporting capability building and consistent application of ESG priorities across markets.
These efforts come as data centre operators face growing expectations to deliver capacity while managing energy, water, climate and cybersecurity risks with greater transparency and accountability.
STT GDC’s 2025 ESG Report reflects a continued evolution in how the Group approaches sustainable growth, with a stronger focus on disciplined execution, operational resilience and long-term performance as it scales its global platform. As digital infrastructure becomes increasingly critical to economies and societies, STT GDC will continue to embed sustainability, risk management and governance into how it designs, builds and operates its data centres.
By working closely with customers, partners and communities, the Group aims to deliver infrastructure that is not only efficient and resilient, but also capable of supporting the next phase of digital growth, including AI-driven workloads, in a responsible and sustainable way.
The full 2025 ESG Report is available at https://www.sttelemediagdc.com/about-us/our-esg-progress
About ST Telemedia Global Data Centres
ST Telemedia Global Data Centres (STT GDC) is one of the fastest-growing data centre providers with a global platform serving as a cornerstone of the digital ecosystem that helps the world to connect. Powering a sustainable digital future, STT GDC operates across Singapore, the UK, Germany, Italy, India, Thailand, South Korea, Indonesia, Japan, the Philippines, Malaysia and Vietnam, providing businesses an exceptional foundation that is built for their growth anywhere. For more information, visit https://www.sttelemediagdc.com/
Energy
London Showcase to Bring Venezuela’s Energy Opportunities to Global Investors Ahead of 2026 Summit
Published
12 hours agoon
July 21, 2026
A high-level London industry showcase on July 30 will bring together UK and European investors, financiers and energy leaders to explore emerging opportunities across Venezuela’s oil, gas and power sectors ahead of Venezuela Energy Week 2026
Designed as a strategic preview of the main event, the London showcase will provide UK and European stakeholders with first-hand insight into Venezuela’s evolving investment landscape while creating opportunities for commercial dialogue with industry leaders, potential partners and key decision-makers.
Home to the world’s largest proven oil reserves and significant natural gas resources, Venezuela is entering a new phase of energy development focused on increasing production, expanding gas commercialization and modernizing critical infrastructure. Ongoing reforms and renewed international engagement are creating opportunities for companies able to provide capital, technology and technical expertise.
The timing is particularly significant as several UK and European energy companies continue to strengthen their presence in Venezuela. UK-based majors Shell and BP are advancing key natural gas developments, with Shell preparing for 2027 drilling at the Dragon offshore gas project and BP signing agreements in April to develop the Cocuina-Manakin offshore gas field, marking its return to the Venezuelan market. Spain’s Repsol recently announced plans to increase production from its Venezuelan assets, while Italy’s Eni is relaunching a heavy crude project in the Orinoco Belt. France’s Maurel & Prom, meanwhile, remains a key partner in strategic assets such as the Urdaneta Oeste field. On the trading and commercialization front, Geneva-headquartered energy trader Vitol has renewed its engagement with Venezuelan crude exports, reflecting broader international interest in reconnecting the country’s resources with global markets.
Against this backdrop, the London Industry Showcase will highlight Venezuela’s re-emerging investment potential while creating a platform for strategic networking and direct engagement with government leaders, national energy companies, regulators and private sector partners.
The event is expected to attract representatives from investment funds, export credit agencies, commercial banks, private equity firms, commodity traders, engineering companies, technology providers and UK-based independent energy companies exploring opportunities across Venezuela’s energy value chain.
The showcase will also provide an exclusive preview of Venezuela Energy Week 2026, including ministerial dialogues, executive forums, technical conferences and dedicated business-to-business networking sessions designed to connect international investors with the decision-makers shaping the country’s energy future.
Taking place on October 26–29, 2026 in Caracas, Venezuela Energy Week serves as the country’s premier platform for advancing investment across the oil, gas and power sectors. By bringing the conversation to London – one of the world’s leading financial and energy centers – the Industry Showcase builds momentum ahead of the flagship event while strengthening ties between international capital and one of the world’s most resource-rich energy markets.
To participate in the London Industry Showcase on July 30 or secure your place at Venezuela Energy Week 2026 in Caracas this October, contact info@venezuelaenergyweek.com to learn more about delegate, sponsorship and partnership opportunities.
Supporting Venezuela’s Earthquake Recovery
Our thoughts are with the people and communities affected by the recent earthquakes in Venezuela. As the country begins the long process of recovery, we encourage members of the global energy community to support relief and reconstruction efforts through the CAF Recovery and Reconstruction Fund for Venezuela, which channels contributions from individuals, companies and organizations to emergency assistance, essential services and long-term rebuilding efforts.
To learn more or make a contribution, please visit the CAF Recovery and Reconstruction Fund for Venezuela (https://apo-opa.co/3RKKqfz).
Distributed by APO Group on behalf of Energy Capital & Power.
Trending
-

 Energy4 days ago
Africa Finance Corporation (AFC), Development Finance Corporation (DFC), Standard Bank and Africa50 Lead Finance Lineup at African Mining Week 2026
-

 Events4 days ago
2026 Hainan Island Carnival Sends a Global Summer Invitation
-
 Energy4 days ago
South Sudan Reforms Target New Investment Push as African Energy Chamber (AEC) Backs Oil Sector Revival
-
Energy4 days ago
VivaJets Returns to African Energy Week (AEW) 2026 as Gold Sponsor After Rapid Fleet and Route Expansion
-
 Business1 day ago
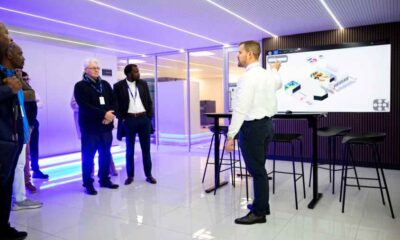
Master Power Technologies Unveils R50m State-of-the-Art Customer Experience Centre at New Midrand Premises
-

 Business1 day ago
Cassava Technologies strengthens Africa’s cloud resilience with Microsoft Azure ExpressRoute Metro designation in Johannesburg
-
 Events1 day ago
Embracing an Intelligent Future: UnionPay Showcases AI Innovation at WAIC 2026
-
Business11 hours ago
ST Telemedia Global Data Centres Delivers on Responsible Scaling, Surpassing 2028 Carbon Intensity Target Three Years Early with Renewables at 83.2%